Using B2B Customer Segmentation to Grow your Wholesale, Distributor or Manufacturing Business
As with any Wholesale, Distributor and Manufacturing business, effective sales strategies derive from the foundations of a strong Ideal Customer Profile (ICP). Serving as a sales and marketing roadmap, a well-defined ICP ensures your business is effectively prioritising time and resources on capturing prospects who are likely to return the most value to your business. However, even once you’ve converted these prospects to customers, sales success is not guaranteed, and you cannot assume they won’t look towards alternatives if you don’t deliver to their expectations - this is where the importance of RFM segmentation comes in!
In broad terms, RFM stands for Recency, Frequency, and Monetary value, and is a B2B customer segmentation method that ranks customers based on how recently they made a purchase, how often they purchase, and how much they spend on average. So, why is this important? Having awareness of customer behaviour helps B2B product sellers predict spending patterns and proactively engage customers before they churn.
In this blog we’ll go into greater detail about what B2B customer segmentation is, why you should care about it, how to calculate and use it, and most importantly, how it impacts all 6 key strategies for growth and profitability in Wholesale, Distributor & Manufacturing businesses.
So...What is RFM?
RFM is a well-known and well-loved technique for segmenting customers by their spend pattern. Essentially, it segments customers by Recency, Frequency and Monetary Value:
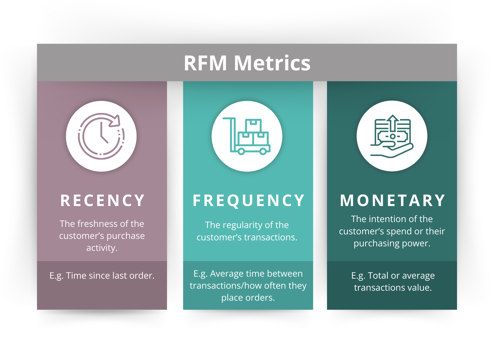
Recency
Recency is a score for how long ago a customer bought from you. It’s usually expressed as a ranking score of 1-3 or 1-5.
Frequency
Frequency is a score for how often a customer buys from you. Typically, this is usually over the last year or two years, and again, expressed as a rank or score of 1-3 or 1-5.
Monetary
Monetary Value is a score for how much a customer spends with you in total over that period. Again, this is scored or ranked from 1-3 or from 1-5.
Dimension Calculations
Calculating these scores can actually become very complex, and to make matters even trickier, scores ideally need to be recalculated daily. Especially in today’s fast-paced environment where several B2B product sellers are challenged with efficiently processing hundreds or thousands of orders, committing time to calculating these scores is merely unfeasible. Even if you were to find the time, manual calculations aimed at covering your entire customer base would be heavily prone to error, non-productive, and monotonous.
So, what’s the solution? Look for a system that has built-in RFM Analysis software – this way you can access insights that will improve retention and maximise revenue without lifting a finger! A CRM system will reap you these exact benefits. Since it already stores all of your customer data, with the addition of B2B customer segmentation functionalities, you’ll have access to automated insights calculated in real-time.
Whether you’re looking to invest in RFM Analysis software or planning to attempt these calculations yourself on a spreadsheet, here’s the info you need to be able to understand how the scores are calculated.
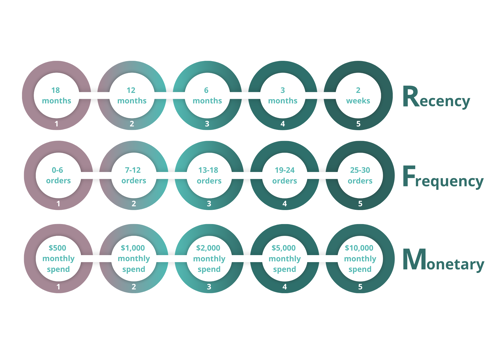
How calculations are scored
For each of the 3 metrics (Recency, Frequency and Monetary Value), your customer data is assigned into buckets to give them a ranking score. These buckets would look something like this:
Based on the customer’s total score from all 3 metrics, they’re then put into a 3-dimensional cube with the highest scoring customers in one corner and the lowest in the opposite corner. But, 3D cubes are hard to imagine and even harder to work with. So, RFM grids are usually flattened out into a 2D representation, like the one below (much easier!):

The 1-5 score along the bottom (x-axis) is the Recency score, and the 1-5 up the left-hand side (y-axis) is a combination of the Frequency and Value (averaged in this case, but in other diagrams expressed as the sum of the two).
So, a new customer will enter in the bottom right-hand corner (high Recency, but low Frequency and low Monetary value), then move up the chain to ’Potential Loyalist’, ’Loyal Customer’ and eventually a ’Champion’ customer - assuming they keep ordering with you! The aim is to ensure customers take this path, moving upwards, and don’t move towards the left-hand side of the grid. You achieve this by recognising that customers in each segment need treating differently and approaching with different methods and styles of communication, or even different special offers and incentives.
Focused Targeting of the different RFM Segments
RFM allows your team to be more proactive, as it enables them to more confidently tailor their approach with each customer, depending on which segment they fall into.
High Scores
High RFM scores identify your most promising customers, enabling your team to build on experiences that keep them engaged.
New Customers:
- Onboard with personal contact
- Get the customer to place repeat orders
- Turn them into regular, loyal customers
Champions:
- Promote new products to these customers
- Get feedback for future considerations
- Obtain referrals & case studies
Low Scores
Identifying customers with low RFM scores is just as important as identifying your Champions and Loyal Customers. Armed with this information, your teams can identify:
- New customers that need to be onboarded & nurtured
- Previously loyal customers that have found a replacement product(s) & should be entered into a re-activation campaign
- Customers who buy low-value items regularly and are prime candidates to be moved up the chain, with an upsell campaign
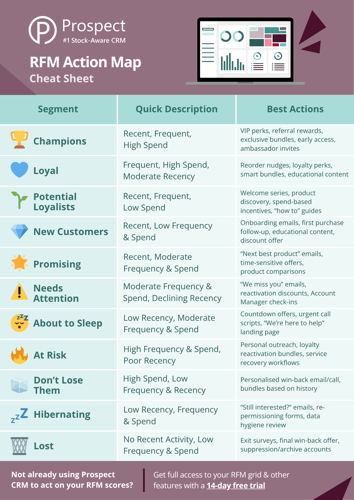
Here’s a handy chart of all the RFM Segments, and some actionable tips for each which can be implemented straight away!
Automate Actionable Insights & Take Proactive Measures with Prospect CRM’s RFM Analysis Software
Benefit from Prospect CRM’s integrative capabilities with your back-office systems and take analysing B2B customer segmentation to another level. Seamlessly synchronising the customer and product data between systems, Prospect CRM taps into siloed data, ensuring your visibility is never skewed. So, let automation do the legwork and watch as the RFM Grid is seamlessly populated in real-time, meaning you can focus on fulfilling orders and engaging with customers. No manual entries, no guess work, and certainly no time wasted!
Be rest assured that with Prospect CRM you’ll never lose the visibility of your customers. With a central dashboard featuring the RFM Grid, your teams can quickly spot trends and identify those at risk of churning. Even drill down into each RFM segment to pinpoint the customers who need the most engagement ensuring no one falls through the cracks. Plus, with easy access to all customer records, tailoring your communications around their previous engagements to win them back couldn’t be simpler.
Sign up for a free trial today and start unlocking the true potential of your customers.
Turn Customer Insights into Action
Knowing your best customers is just the start, and the real value comes from what you do next. Download the RFM Action Map to discover proven steps for engaging, retaining, and growing each segment of your customer base.