How to Scale & Grow in Food & Beverages Using Inventory & Accounts Software
 System Integration Expert and Managing Director of Outserve, Philip Oakley, shared his specialist advice on how to get the most out of software for businesses in the food and beverage industry. From reporting to road mapping, here are some of our key takeaways from the online event in case you missed it...
Strategy
If you’ve got plans to grow your business, you need to specifically look for systems that are fit for your future. Many businesses are aware of their problems and pain points but are unsure how to overcome these drawbacks.
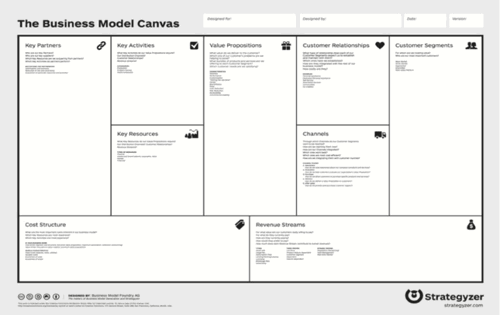
A Business Model Canvas can help to build a strategy by segmenting your customer relationships, analysing your cost efficiency, and identifying areas for improvement, so that you can determine where software needs to be implemented. Using this canvas, you can start to map your activities, relationships and costs to systems that you use today, as well as systems you could be using to achieve your goals. It’s important to use a business model that segments your business activities by specific and mutually exclusive categories. Ultimately, different businesses have different goals, so identifying the areas you want to develop will accelerate the process.

People & Process
One of the biggest challenges that many businesses face is having the means to keep processes documented - if you’re not keeping up with business and internal interactions, you’re missing a trick.
Using a Red, Amber, Green (RAG) analysis, you can pinpoint the correlation between the way you run your daily operations, and the direct impact this is having on your overall business performance and efficiency.
- Green: using chiefly automated processes resulting in low risk efforts
- Amber: processes require some manual effort which are medium risk
- Red: high risk and requires exclusively manual processing
These high-risk red areas stop businesses from scaling and growing efficiently because they require manual processing that leaves room for human error. Product businesses like those in the food and beverage industry receive hundreds or thousands (if not hundreds of thousands!) of orders which can become a real issue without the help of automation.
Something that can help with this is executing high level calculations to identify where these issues lie, work out the cost effect of the pain point or challenge, and start to put some figures around it. These calculations can start to give you a flavour of what these issues could be costing your business. Perhaps for every thousand orders, 10 of these are incorrect, which is an entirely avoidable cost - so how can you circumvent this costly error?

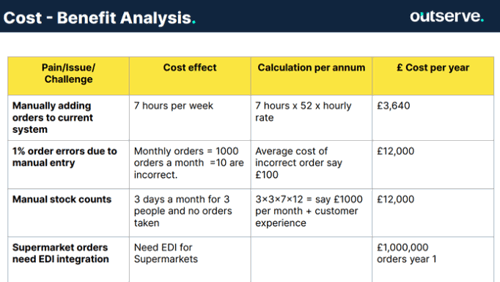
Automating your stock count, for example, helps you grasp your live stock data, which can contribute significantly to your cost reduction efforts. You can begin to take control of your stock count by monitoring and managing if you miss an order due to a lack of stock, or if you overstock and could be saving valuable warehousing capacity and expenses.
Start with the End
If you look at changing or implementing systems, what do you want to get out of it? What does the "end" look like?
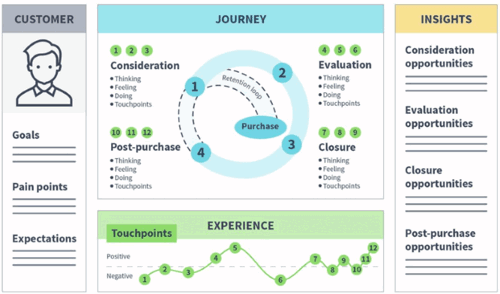
Mapping your customer journey is a great place to start when considering these questions. There are plenty of available models out there that you can use to quickly come up with a customer journey; great for evaluating how to make their experience better and what could make the buying process easier for them. Think about how you receive customer orders, how invoicing works, as well as how easy it is to place an order (in other words, do you have an optimised quote-to-order workflow in place?). Even if you’re running your business 100% digitally through an eCommerce platform, you can still identify the various touchpoints that can affect customer experience by journey mapping.

Reporting
There are many reporting tools (like Microsoft Power BI) that can help you see figures against a budget and over a rolling period which take order and customer analysis and breaks them down in different areas. RFM Analysis is also a great technique for product businesses in particular, allowing you to look at a whole client base and understand the analytics behind their spend patterns.
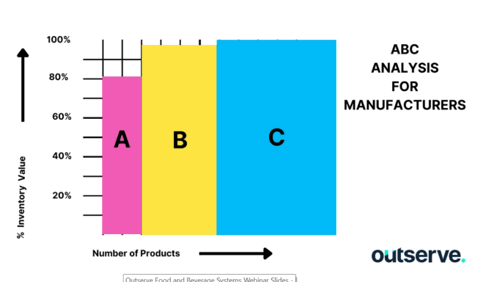
The Pareto Principle outlines the theory that 80% of an output from a system is determined by 20% of the input and, by implementing an automated reporting system into your processes, you’re given the ability to balance the input and output of your resources.

Tech Stack
There are so many solutions available out there to manage inventory and accounts, so knowing what solutions are right for you can be difficult.
You need to start by understanding that there should be a constant flow of data through the various systems you use. It’s important to have a layer that takes data into a reporting tool, like CRM, that allows for integration between the various systems you already have in place, and the systems you’re planning on bringing in. By mapping your systems integration plan using a "tech stack", you can efficiently find automated ways to minimise duplication of effort and manual input across your business operations.
